
From manual reports to live Power BI dashboards in two weeks
The entity's analysts relied on manual reports that took days. POTC delivered an intensive Business Intelligence with Excel & Power BI program in its Riyadh halls, with hands-on labs on the entity's own datasets — and operational dashboards were in production by week two.
The challenge
The entity's reporting cycle depended on manually compiling data from scattered sources — a single report took days and reached decision-makers late. Leadership wanted a sustainable in-house BI capability instead of relying on external parties, with analysts trained on their real data rather than hypothetical examples.
What we did
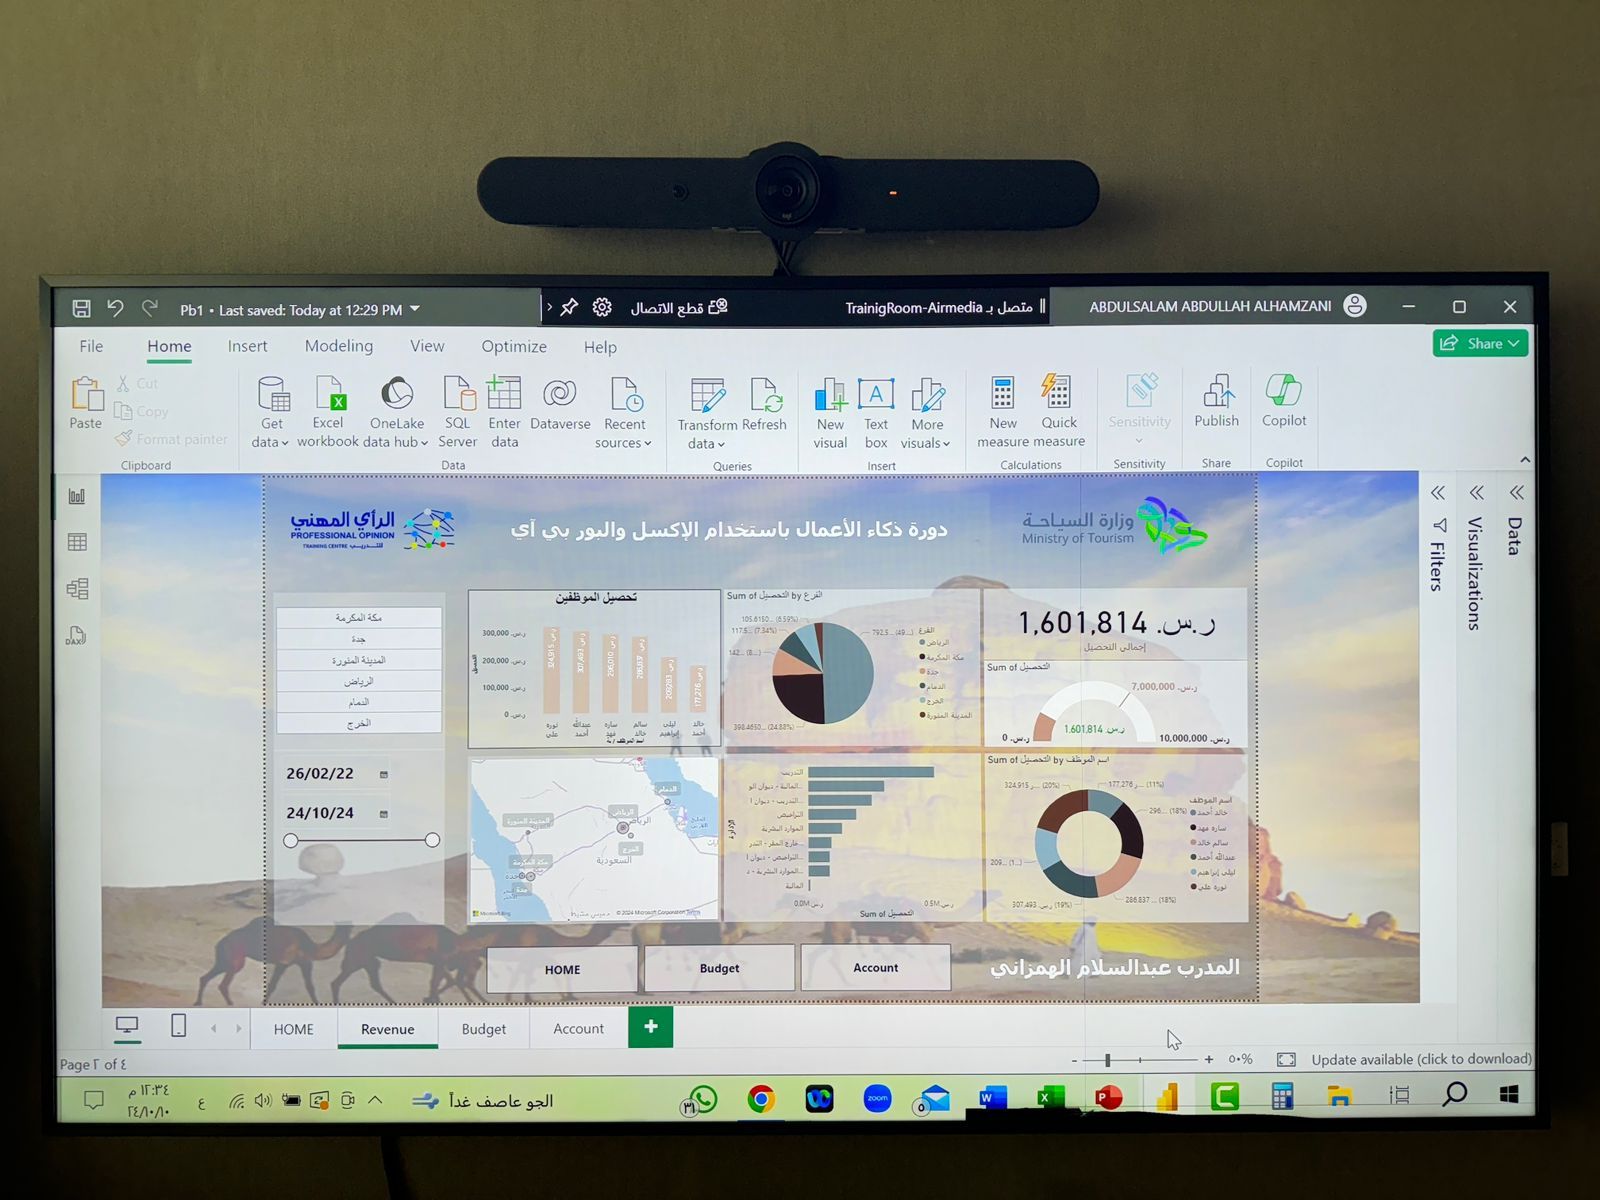
An intensive 'Business Intelligence with Excel & Power BI' program in POTC's Riyadh training halls
Hands-on labs running directly on the entity's actual datasets instead of dummy data
Dashboards built live during the sessions — the photo is from the actual program
Certifying a core group of analysts as in-house BI champions to lead the rollout after the program
Measuring impact with operational metrics: report-preparation time and dashboards published to production
The results
Operational dashboards in production by week two
Reporting time cut from days to minutes
In-house BI champions certified
Leadership decisions on live data
We left the program with dashboards actually running on our data — it wasn't theoretical training, it was real operations from day one.